

Predictive Analytics in Python: A Hands-On Guide
- Jan 6, 2024
- 8 min read
Updated: Jan 13
Predictive analytics focuses on using historical data to anticipate future outcomes and make informed, data-driven decisions. It is widely applied across domains such as finance, marketing, healthcare, and manufacturing to optimize strategies, mitigate risks, and enhance operational efficiency.
In this blog, we will cover the core concepts of predictive analytics, its importance and key benefits, common techniques and algorithms including regression, clustering, time series analysis, and neural networks, and conclude with a practical Python demonstration combining PCA, K-Means clustering, and neural network regression to showcase how real-world data can be transformed into actionable insights.

What is Predictive Analytics?
Predictive analytics is the art and science of using historical data to forecast what’s likely to happen in the future. By applying statistical algorithms, machine learning models, and data mining techniques, it uncovers hidden patterns, correlations, and trends within large datasets. These insights allow organizations to anticipate potential outcomes, make smarter decisions, and take proactive steps before issues arise or opportunities slip away.
Industries across the globe are leveraging predictive analytics to gain an edge:
Finance: Forecasting market trends, assessing credit risks, and identifying investment opportunities.
Marketing: Understanding customer behavior, predicting campaign effectiveness, and reducing churn.
Healthcare: Anticipating patient outcomes, identifying disease trends, and improving treatment plans.
Manufacturing: Optimizing supply chains, predicting equipment breakdowns, and enhancing operational efficiency.
By turning raw data into actionable insights, predictive analytics helps organizations operate smarter, not just harder.
Importance of Predictive Analytics
In today’s fast-paced, data-driven business environment, predictive analytics is no longer optional—it’s essential. It empowers organizations to anticipate future scenarios, minimize risks, and capitalize on opportunities to drive growth and competitive advantage. Key benefits include:
Proactive Decision-Making: Move beyond reactive strategies. Predict trends before they impact your business and stay ahead of competitors.
Optimized Strategies: Gain deeper understanding of customer behavior, market dynamics, and operational patterns to refine strategies and allocate resources effectively.
Risk Mitigation: Detect potential vulnerabilities early, implement preventive measures, and reduce exposure to financial, operational, or security threats.
Enhanced Efficiency: Streamline workflows, forecast equipment failures, and anticipate customer demands, resulting in higher productivity and cost savings.
Customer Satisfaction: Deliver personalized experiences based on insights into customer preferences, boosting loyalty and engagement.
Informed Decision-Making: Rely on evidence-based insights rather than intuition, reducing uncertainty and increasing confidence in business decisions.
Predictive analytics is not just a technical tool—it’s a strategic enabler. Organizations that embrace it can transform raw data into a forward-looking guide for growth, innovation, and efficiency. By continuously analyzing patterns and refining predictions, businesses can anticipate market shifts, understand evolving customer needs, and respond to challenges before they escalate. Over time, predictive analytics becomes a powerful feedback loop: the more data you collect, the more precise your insights become, allowing for increasingly intelligent decisions across every area of operations. From shaping marketing campaigns and optimizing supply chains to forecasting financial performance and enhancing customer experience, predictive analytics provides a roadmap for sustainable success in an increasingly competitive and uncertain world.
Techniques and algorithms used in predictive analytics
Predictive techniques and algorithms serve various purposes in predictive analytics, each suited to specific data types, complexities, and objectives, enabling organizations to derive valuable insights and make accurate predictions from diverse datasets.
1. Regression Analysis:
Regression is a statistical method used in predictive analytics to model the relationship between a dependent variable (often referred to as the target or outcome) and one or more independent variables (known as predictors or features). It aims to predict the value of the dependent variable based on the values of the independent variables.
Linear Regression: Predicts a continuous target variable based on one or multiple predictor variables by fitting a linear equation.
Logistic Regression: Models the probability of a binary outcome, useful for classification tasks.
Polynomial Regression: Extends linear regression to fit a polynomial equation to the data. It accommodates curved relationships between variables by introducing higher-order terms.
2. Time Series Analysis:
Time Series Analysis is a statistical method used to analyze and interpret time-ordered data points, where observations are recorded sequentially at regular intervals. It aims to identify patterns, trends, and seasonal variations within the data to make predictions or derive insights.
ARIMA (AutoRegressive Integrated Moving Average): Models time series data by accounting for auto-regression, differencing, and moving averages.
Exponential Smoothing: Applies weighted averages to past observations to forecast future values in time series data.
3. Machine Learning Algorithms:
Machine learning algorithms are computational models that enable computers to learn patterns and relationships from data without explicit programming. These algorithms improve their performance over time as they're exposed to more data. There are various types of machine learning algorithms based on their learning style and application, few of them are mentioned below:
Decision Trees: Constructs a tree-like structure to make decisions based on feature splits, useful for both classification and regression tasks.
Random Forest: Ensemble method utilizing multiple decision trees to improve predictive accuracy and reduce overfitting.
Gradient Boosting Machines (GBM): Builds multiple weak models sequentially to create a strong predictive model.
Support Vector Machines (SVM): Finds the best separation boundary for classification tasks.
4. Neural Networks and Deep Learning:
Deep learning is a subset of machine learning and artificial intelligence (AI) that involves training and using artificial neural networks composed of multiple layers to learn from data. It aims to mimic the human brain's ability to recognize patterns, process information, and make decisions by automatically extracting hierarchical representations of data.
Feedforward Neural Networks: Comprise interconnected layers of nodes for prediction tasks.
Recurrent Neural Networks (RNN): Handles sequential data by considering temporal dependencies.
Long Short-Term Memory (LSTM): A type of RNN suitable for learning long-term dependencies in sequential data.
5. Clustering Techniques:
Clustering is a machine learning technique used for grouping similar data points together based on their inherent characteristics or features. It aims to partition a dataset into subsets or clusters, where data points within the same cluster share common traits and are more similar to each other compared to those in other clusters.
K-means Clustering: Groups data points into clusters based on similarity.
Hierarchical Clustering: Forms clusters hierarchically, creating a tree-like structure of clusters.
6. Ensemble Methods:
Ensemble methods in machine learning involve combining multiple individual models to improve predictive performance, robustness, and generalizability over a single model. These methods aim to leverage the collective intelligence of diverse models to achieve better results.
Bagging: Constructs multiple models independently and aggregates their predictions for better accuracy.
Boosting: Builds models sequentially, with each model learning from the errors of its predecessor.
7. Dimensionality Reduction:
Dimensionality reduction is a technique used in machine learning and data analysis to reduce the number of input variables or features in a dataset while preserving essential information. Its primary goal is to simplify complex datasets by representing them in a lower-dimensional space, facilitating easier visualization, computation, and model training.
Principal Component Analysis (PCA): Reduces the dimensions of the dataset while retaining essential information.
Distributed Stochastic Neighbor Embedding (t-SNE): Focuses on preserving local relationships and visualizing high-dimensional data in a lower-dimensional space, commonly used for visualization purposes.
8. Natural Language Processing (NLP) Techniques:
Predictive Natural Language Processing (NLP) involves using machine learning and statistical techniques to analyze and understand text data, enabling systems to predict outcomes or generate responses based on language understanding. It encompasses various techniques to process, analyze, and predict patterns within textual data.
Text Mining and Sentiment Analysis: Analyzes textual data to predict sentiment, classify documents, or forecast trends.
Text Classification: Categorizing documents or text into predefined classes or topics (e.g., spam detection, news categorization).
Named Entity Recognition (NER): Identifying and classifying entities (such as names of people, organizations, locations) in text.
Machine Translation: Automatically translating text from one language to another.
Chatbots and Question Answering: Generating responses or answering questions based on natural language input.
Predictive Analytics with PCA, K-Means Clustering, and Neural Networks in Python
In the realm of modern data science, predictive analytics plays a crucial role in uncovering hidden patterns and making data-driven forecasts. This hands-on demonstration walks you through a complete pipeline—starting with dimensionality reduction using PCA, followed by K-Means clustering for pattern discovery, and ending with neural network-based regression to predict continuous outcomes.
By combining unsupervised and supervised machine learning techniques, this walkthrough showcases how real-world data can be transformed into actionable insights.
Step 1: Data Generation and Preparation
We generate a synthetic regression dataset with 10 features and 500 samples using make_regression, simulating a scenario where continuous values (targets) depend on multiple inputs.
from sklearn.datasets import make_regression
import pandas as pd

X, y = make_regression(n_samples=500, n_features=10, noise=10, random_state=42)

# Convert to DataFrame for clarity
df = pd.DataFrame(X, columns=[f'Feature_{i}' for i in range(X.shape[1])])
df['Target'] = y
df.head()
Output:
Feature_0 | Feature_1 | Feature_2 | Feature_3 | Feature_4 | Feature_5 | Feature_6 | Feature_7 | Feature_8 | Feature_9 | Target | |
0 | 1.024063 | 2.061504 | 2.558199 | -0.564248 | 1.542110 | -0.551858 | 1.208366 | 2.006093 | 0.592527 | 0.184551 | 455.829343 |
1 | -0.637740 | 0.289169 | 0.674819 | -1.122722 | 0.166452 | -0.049464 | 2.455300 | 0.492451 | -0.530997 | 0.382410 | 196.698253 |
2 | 0.779349 | -0.846851 | 0.757495 | 1.370536 | 0.283751 | -1.050141 | 1.249619 | -0.987873 | -0.039020 | 0.695203 | 105.781478 |
3 | 0.513908 | -1.000331 | -0.474904 | 0.871297 | 0.126380 | 0.586694 | -0.677745 | 1.938929 | 0.179582 | -1.345980 | 32.629581 |
4 | -0.183150 | 0.815501 | -0.213457 | 0.496199 | 0.511500 | -0.327017 | -0.048089 | 1.935154 | -0.356673 | -0.535317 | 171.616971 |
Step 2: Feature Scaling (Standardization)
We standardize the dataset using StandardScaler so each feature has zero mean and unit variance. This is essential before PCA or Neural Networks to ensure equal treatment of all features.
from sklearn.preprocessing import StandardScaler

scaler = StandardScaler()
X_scaled = scaler.fit_transform(df.drop('Target', axis=1))
Step 3: Dimensionality Reduction with PCA
We reduce the data from 10 dimensions to 2 using Principal Component Analysis (PCA). This helps in visualizing the internal structure and patterns of the dataset.
Dimensionality reduction not only allows visual analysis but also helps clustering algorithms perform better by removing noise and multicollinearity.
from sklearn.decomposition import PCA
import matplotlib.pyplot as plt

pca = PCA(n_components=2)
X_pca = pca.fit_transform(X_scaled)

# Visualize PCA projection
plt.figure(figsize=(8, 6))
plt.scatter(X_pca[:, 0], X_pca[:, 1], c='skyblue', alpha=0.7)
plt.xlabel("PCA 1")
plt.ylabel("PCA 2")
plt.title("PCA - Dimensionality Reduction")
plt.grid(True)
plt.show()
Output:

Step 4: Unsupervised Clustering with K-Means
We apply K-Means clustering to the PCA-transformed data to detect natural groupings. We choose 3 clusters arbitrarily (in real scenarios, use techniques like the elbow method).
Clustering helps us discover hidden subpopulations or data archetypes without labels, which is especially helpful in exploratory data analysis.
from sklearn.cluster import KMeans
from sklearn.metrics import silhouette_score

kmeans = KMeans(n_clusters=3, random_state=42)
clusters = kmeans.fit_predict(X_pca)

# Visualize clusters
plt.figure(figsize=(8, 6))
plt.scatter(X_pca[:, 0], X_pca[:, 1], c=clusters, cmap='viridis')
plt.scatter(kmeans.cluster_centers_[:, 0], kmeans.cluster_centers_[:, 1],
            s=200, c='red', label='Centroids')
plt.xlabel("PCA 1")
plt.ylabel("PCA 2")
plt.title("K-Means Clustering on PCA-Reduced Data")
plt.legend()
plt.grid(True)
plt.show()

# Evaluate clustering
print("Silhouette Score:", silhouette_score(X_pca, clusters))

Output:
Silhouette Score: 0.32116482266866486: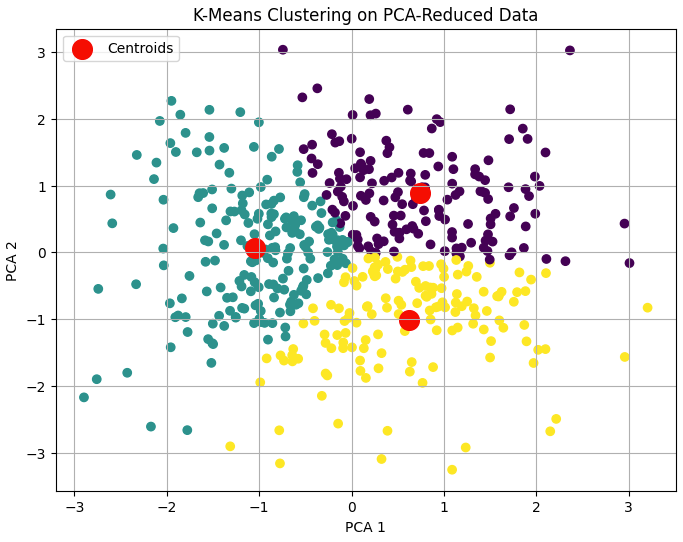
Step 5: Regression Modelling with Neural Networks
We train a fully connected neural network to predict the target variable (regression) using the original 10 scaled features. The model is built using Keras with two hidden layers and evaluated on unseen test data.
They can capture non-linear relationships and complex feature interactions more effectively than linear models, especially in high-dimensional data.
from sklearn.model_selection import train_test_split
from tensorflow.keras.models import Sequential
from tensorflow.keras.layers import Dense

# Split data
X_train, X_test, y_train, y_test = train_test_split(X_scaled, y, test_size=0.2, random_state=42)

# Build model
model = Sequential()
model.add(Dense(64, input_dim=X_train.shape[1], activation='relu'))
model.add(Dense(32, activation='relu'))
model.add(Dense(1))  # Output layer

model.compile(optimizer='adam', loss='mse', metrics=['mae'])

# Train model
history = model.fit(X_train, y_train, epochs=50, batch_size=16,
                    validation_split=0.2, verbose=0)

# Evaluate model
loss, mae = model.evaluate(X_test, y_test)
print(f"\nTest Mean Absolute Error: {mae:.2f}")

Output:
4/4 ━━━━━━━━━━━━━━━━━━━━ 0s 10ms/step - loss: 226.9165 - mae: 12.2721

Test Mean Absolute Error: 11.75
Step 6: Visualizing Regression Performance
We visualize how well the neural network predicted actual target values using a scatterplot, and track training/validation loss over epochs.
# Plot training loss
plt.figure(figsize=(8, 5))
plt.plot(history.history['loss'], label='Train Loss')
plt.plot(history.history['val_loss'], label='Val Loss')
plt.title('Training and Validation Loss')
plt.xlabel('Epochs')
plt.ylabel('Loss (MSE)')
plt.legend()
plt.grid(True)
plt.show()

# Predict and compare
y_pred = model.predict(X_test)

plt.figure(figsize=(8, 6))
plt.scatter(y_test, y_pred, alpha=0.6)
plt.xlabel("Actual Values")
plt.ylabel("Predicted Values")
plt.title("Regression: Actual vs Predicted")
plt.grid(True)
plt.show()
Output:

A comparison of predictions.

Conclusion: Turning Data into Foresight with Predictive Analytics
Predictive analytics stands at the heart of modern data-driven decision-making. By merging theoretical depth with practical implementation, this blog demonstrated how dimensionality reduction (PCA), clustering (K-Means), and neural networks for regression can work together to extract meaningful patterns, group similar behaviors, and predict future outcomes — all from the same dataset.
On a technical level, PCA simplified high-dimensional data, revealing its most informative structure. K-Means clustering then helped identify natural groupings within this reduced space, offering insights into hidden relationships. Finally, a neural network regression model showcased the power of machine learning to forecast precise outcomes from structured numerical data. This holistic approach mirrors real-world analytics pipelines where exploration, segmentation, and prediction go hand in hand.
As we've seen, the combination of statistical foundations and hands-on machine learning tools in Python makes predictive analytics not just powerful — but also highly accessible. Whether you're an analyst, engineer, or entrepreneur, leveraging these tools can unlock a new level of competitive advantage in an increasingly data-centric world.


