

Implementing Decision Trees on Iris dataset in Python
- Aug 9, 2024
- 8 min read
Updated: May 12
Machine learning models often appear complex, but Decision Trees offer a far more intuitive approach to classification problems. By breaking data into smaller decision-based rules, these models can classify observations in a way that is both effective and easy to interpret. Their tree-like structure makes them especially useful for understanding how predictions are formed from input features.
In this blog post, we will use the Iris dataset to build and train a Decision Tree classifier using Python and scikit-learn. Along the way, we will prepare the dataset, train the model, evaluate its accuracy, visualize the decision tree structure, and analyze feature importance to better understand which flower characteristics influence the classification process the most. Tiny measurements of petals and sepals quietly becoming one of machine learning’s longest-running educational laborers.

Classification using decision trees on the Iris dataset in Python
Classification using decision trees on the Iris dataset in Python involves using the DecisionTreeClassifier class from the scikit-learn library to distinguish between three species of iris flowers: Iris setosa, Iris versicolor, and Iris virginica. The Iris dataset, a classic dataset in machine learning, consists of 150 samples with four features: sepal length, sepal width, petal length, and petal width. To implement the decision tree classifier, the dataset is first split into training and testing sets to evaluate the model's performance. The DecisionTreeClassifier is then trained on the training data, learning patterns that differentiate the three species based on the features.
The trained model's effectiveness is evaluated using the testing set, and its performance is measured by calculating metrics such as accuracy. The decision tree can be visualized to show the hierarchical decision-making process, with nodes representing decisions based on feature values and leaf nodes representing class labels. Each split in the tree is based on a feature that maximizes the separation between classes, often measured by metrics such as Gini impurity or entropy. The visualization provides an intuitive understanding of how the model makes classifications, highlighting the importance of certain features in distinguishing between the species. Additionally, the feature importances can be extracted, indicating which features have the most significant influence on the classification decisions.
This approach not only allows for accurate predictions but also provides valuable insights into the underlying structure of the data and the key characteristics that differentiate the species.
Iris dataset in Python
The Iris dataset is one of the most well-known and commonly used datasets in the field of machine learning and data science. It serves as a standard benchmark for testing and comparing various machine learning algorithms. The dataset consists of 150 samples of iris flowers, with each sample having four features and a corresponding class label. The features represent the physical dimensions of the flowers and include:
Sepal length (in centimeters)
Sepal width (in centimeters)
Petal length (in centimeters)
Petal width (in centimeters)
Each flower in the dataset belongs to one of three species:
Iris setosa
Iris versicolor
Iris virginica
The class labels are encoded as integers, with 0 representing Iris setosa, 1 representing Iris versicolor, and 2 representing Iris virginica.
The Iris dataset is often used for classification tasks, where the goal is to predict the species of an iris flower based on its features. The dataset is particularly valuable for its simplicity and balance, as it contains an equal number of samples (50) for each species. Moreover, the four features exhibit enough variation to make the classification task non-trivial, while still being manageable for visual exploration and understanding.
The dataset can be easily loaded in Python using the scikit-learn library, which provides it as a built-in dataset. The balanced and well-documented nature of the Iris dataset makes it an excellent choice for demonstrating machine learning techniques, including decision trees, support vector machines, k-nearest neighbors, and more. It also serves as a foundational dataset for educational purposes, helping newcomers to the field understand fundamental concepts in machine learning and data analysis.
Implementing decision trees on the Iris dataset in Python can be done using the scikit-learn library, which provides a simple and efficient way to implement machine learning algorithms. The Iris dataset is a classic dataset that contains 150 samples of iris flowers, with four features and three classes (species).
Implementing decision trees on the Iris dataset in Python
Decision trees are a popular machine learning algorithm used for classification and regression tasks, and they are particularly valued for their simplicity and interpretability. In Python, decision trees can be implemented using the DecisionTreeClassifier and DecisionTreeRegressor classes from the scikit-learn library. These classes provide an easy-to-use interface for constructing and training decision trees on various datasets. A decision tree works by recursively splitting the data based on certain feature values to form a tree-like structure, where each internal node represents a "decision" based on a feature, each branch represents the outcome of the decision, and each leaf node represents a class label (for classification) or a predicted value (for regression).
The criteria for splitting the data at each node can be specified using measures like Gini impurity or information gain, ensuring that the splits result in purer subsets of data. One of the main advantages of decision trees is that they are easy to interpret; the model's decisions can be visualized as a tree, making it straightforward to understand how different features contribute to the final prediction. Additionally, decision trees can handle both numerical and categorical data and require minimal data preprocessing. However, they are prone to overfitting, especially with complex trees. To mitigate this, techniques such as pruning, setting a maximum depth, or using ensemble methods like Random Forests are commonly employed.
Overall, decision trees in Python, facilitated by libraries like scikit-learn, offer a powerful and intuitive approach for building predictive models. Here's a step-by-step guide to implementing a decision tree classifier on the Iris dataset:
1. Import Libraries
Before building the Decision Tree model, the required libraries need to be imported. NumPy and Pandas help with numerical operations and data handling, while scikit-learn provides tools for loading the Iris dataset, splitting the data, training the classifier, and evaluating model performance. Matplotlib and the tree module are included to visualize how the Decision Tree makes classification decisions.
import numpy as np
import pandas as pd
from sklearn.datasets import load_iris
from sklearn.model_selection import train_test_split
from sklearn.tree import DecisionTreeClassifier
from sklearn.metrics import accuracy_score
from sklearn import tree
import matplotlib.pyplot as plt
2. Load the Iris Dataset
The Iris dataset is loaded using scikit-learn and separated into feature variables (X) and target labels (y). The dataset contains measurements such as sepal length, sepal width, petal length, and petal width for different iris flower species. A Pandas DataFrame is also created to organize the dataset in a more readable tabular format for easier inspection and analysis.
# Load the Iris dataset
iris = load_iris()
X = iris.data # Features
y = iris.target # Target labels

# Convert to DataFrame for better visualization (optional)
df = pd.DataFrame(data=np.c_[iris['data'], iris['target']], columns=iris['feature_names'] + ['target'])
3. Split the Dataset into Training and Testing Sets
To evaluate the model properly, the dataset is divided into training and testing subsets using train_test_split(). The training data allows the Decision Tree classifier to learn patterns from the flower measurements, while the testing data helps measure how accurately the model performs on unseen samples. Setting random_state=42 ensures reproducible results during execution.
# Split the dataset into training and testing sets
X_train, X_test, y_train, y_test = train_test_split(X, y, test_size=0.3, random_state=42)
4. Train the Decision Tree Classifier
The DecisionTreeClassifier is initialized and trained using the training dataset. During training, the algorithm learns a hierarchy of decision rules by selecting feature splits that best separate the iris flower species into distinct categories. Once trained, the model can classify new flower samples based on these learned decision paths.
# Initialize the Decision Tree Classifier
clf = DecisionTreeClassifier(random_state=42)

# Train the model
clf.fit(X_train, y_train)
5. Make Predictions and Evaluate the Model
After training, the model predicts the flower species for the testing dataset using the predict() function. The predictions are then evaluated using accuracy_score(), which calculates the percentage of correctly classified samples. A high accuracy score indicates that the Decision Tree model is successfully learning relationships between the flower features and their corresponding species labels.
# Predict the test set results
y_pred = clf.predict(X_test)

# Calculate the accuracy
accuracy = accuracy_score(y_test, y_pred)
print(f'Accuracy: {accuracy * 100:.2f}%')
6. Visualize the Decision Tree
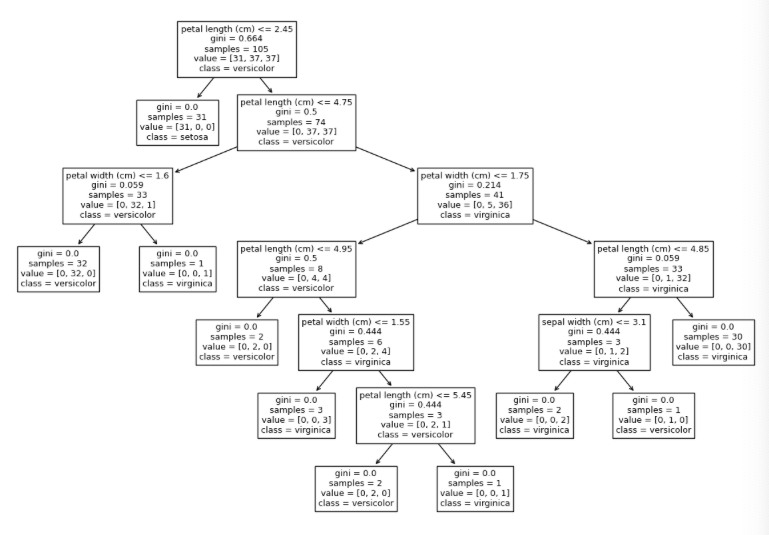
Visualizing the Decision Tree makes it easier to understand how the model classifies different iris flower species based on their features. Using Matplotlib and scikit-learn’s plot_tree() function, the complete tree structure can be displayed along with feature names and target class labels. The figure size is adjusted to improve readability and make the branching structure easier to interpret.
# Plot the decision tree
plt.figure(figsize=(15,10))
tree.plot_tree(clf, feature_names=iris.feature_names, class_names=iris.target_names)
plt.show()
The generated visualization shows how the classifier splits the dataset at different nodes using feature-based conditions such as petal length and petal width. Each branch represents a decision path that eventually leads to a predicted flower species, providing a clear and interpretable view of the model’s decision-making process.
7. Feature Importance
Decision Trees can also reveal which features contribute the most to the classification process. The feature_importances_ attribute assigns an importance score to each feature based on how effectively it helps split the dataset into different classes. Printing these values helps identify which flower measurements have the greatest influence on the model’s predictions.
# Print feature importances
importances = clf.feature_importances_
for feature, importance in zip(iris.feature_names, importances):
    	print(f'{feature}: {importance:.4f}')
The output shows that petal length has the highest importance score, making it the most influential feature for classifying iris flower species. Petal width also contributes to the decision-making process, while sepal length has little to no impact in this trained model.
sepal length (cm): 0.0000
sepal width (cm): 0.0191
petal length (cm): 0.8933
petal width (cm): 0.0876
These importance scores provide valuable insight into how the classifier prioritizes different features when making predictions. Turns out petals are carrying the entire classification operation while sepals are mostly standing around contributing emotional support.
Complete Implementation for Decision Trees on the Iris Dataset in Python
The complete implementation of decision trees on the Iris dataset in Python involves using the scikit-learn library to load the dataset, split it into training and testing sets, train a DecisionTreeClassifier, and evaluate its performance. This process includes visualizing the decision tree and assessing feature importance, providing both accurate predictions and insights into the model's decision-making process. Below is the summation fort the whole code:
import numpy as np
import pandas as pd
from sklearn.datasets import load_iris
from sklearn.model_selection import train_test_split
from sklearn.tree import DecisionTreeClassifier
from sklearn.metrics import accuracy_score
from sklearn import tree
import matplotlib.pyplot as plt
# Load the Iris dataset
iris = load_iris()
X = iris.data # Features
y = iris.target # Target labels
# Convert to DataFrame for better visualization
df = pd.DataFrame(data=np.c_[iris['data'], iris['target']], columns=iris['feature_names'] + ['target'])
# Split the dataset into training and testing sets
X_train, X_test, y_train, y_test = train_test_split(X, y, test_size=0.3, random_state=42)
# Initialize the Decision Tree Classifier
clf = DecisionTreeClassifier(random_state=42)
# Train the model
clf.fit(X_train, y_train)
# Predict the test set results
y_pred = clf.predict(X_test)
# Calculate the accuracy
accuracy = accuracy_score(y_test, y_pred)
print(f'Accuracy: {accuracy * 100:.2f}%')
# Plot the decision tree
plt.figure(figsize=(15,10))
tree.plot_tree(clf, filled=True, feature_names=iris.feature_names, class_names=iris.target_names)
plt.show()
# Print feature importances
importances = clf.feature_importances_
for feature, importance in zip(iris.feature_names, importances):
print(f'{feature}: {importance:.4f}')
Conclusion
In conclusion, decision trees are an accessible and interpretable machine learning algorithm, particularly useful for classification and regression tasks. Using Python's scikit-learn library, they can be easily implemented and applied to datasets like the Iris dataset. The Iris dataset, with its well-balanced classes and clearly defined features, serves as an ideal example for demonstrating decision tree classifiers. Decision trees work by recursively splitting data based on feature values, creating a tree structure that guides decision-making. This structure not only allows for accurate predictions but also provides a clear visualization of how decisions are made, making it easier to understand and explain the model's outputs. However, while decision trees are powerful, they can be prone to overfitting, a challenge that can be addressed through various techniques like pruning and the use of ensemble methods.
Despite these challenges, decision trees remain a fundamental and widely-used tool in the machine learning toolkit, valued for their ease of use and interpretability. Whether used in simple applications or as part of more complex ensemble methods, decision trees offer a robust approach for analyzing and making predictions from data.


