

Hands-On Unsupervised Learning Algorithms with Python
- Dec 20, 2023
- 10 min read
Updated: Mar 10
In many real-world datasets, labeled information is either unavailable or extremely expensive to obtain. This is where unsupervised learning becomes essential. Instead of learning from predefined outputs, unsupervised algorithms analyze raw data to uncover hidden patterns, relationships, and structures that may not be immediately visible.
By identifying natural groupings, reducing complex feature spaces, and detecting unusual observations, unsupervised learning enables data scientists to explore datasets more effectively. These techniques are widely used in areas such as customer segmentation, anomaly detection, image analysis, and large-scale data exploration, where discovering structure in data is often more valuable than predicting predefined outcomes.
In this hands-on guide, we explore several widely used unsupervised learning algorithms and implement them using Python. Using tools such as Scikit-learn, Matplotlib, and Seaborn, we walk through practical examples including K-Means clustering, DBSCAN, PCA, Isolation Forest, Hierarchical Clustering, and Mean Shift.

What is Unsupervised Learning?
Unsupervised learning is a fundamental branch of machine learning that focuses on discovering hidden patterns in unlabeled data. Instead of learning from predefined input-output pairs, the algorithm analyzes the structure of the dataset and identifies relationships, similarities, or patterns on its own.
Unlike supervised learning, where models are trained using labeled examples, unsupervised learning operates without known outcomes. The system attempts to organize data by grouping similar observations, compressing complex information, or identifying unusual patterns that stand out from the rest of the dataset.
This approach becomes particularly valuable in situations where labeled datasets are limited, expensive, or difficult to obtain. Businesses and researchers frequently rely on unsupervised learning to analyze customer behavior, detect anomalies in system logs, explore high-dimensional datasets, and uncover natural groupings in data that might otherwise remain hidden.
A defining characteristic of unsupervised learning is that the model works without explicit guidance. The algorithm searches for meaningful patterns, clusters, and relationships within the data. Because of this exploratory nature, unsupervised learning is often used during the early stages of data analysis to better understand the structure and distribution of information before building predictive models.
Common Types of Unsupervised Learning
Unsupervised learning techniques play a major role in modern data science because they allow analysts to extract insights from raw datasets without relying on labeled examples. These techniques help reveal structure, relationships, and patterns that might not be immediately obvious.
1. Clustering: It is one of the most widely used unsupervised learning techniques. It works by grouping data points based on similarity in their features. Observations within the same cluster share similar characteristics, while data points in different clusters remain distinct from one another. Clustering is widely applied in areas such as customer segmentation, recommendation systems, and social network analysis, where identifying groups with shared traits can provide valuable insights.
Common clustering algorithms include K-Means Clustering, Hierarchical Clustering (Agglomerative and Divisive), DBSCAN (Density-Based Spatial Clustering of Applications with Noise), Mean Shift Clustering, Gaussian Mixture Models (GMM), and OPTICS (Ordering Points To Identify the Clustering Structure).
2. Dimensionality Reduction: It focuses on simplifying complex datasets by reducing the number of input variables while preserving important structural information. High-dimensional data can be difficult to visualize and computationally expensive to process. These transform the data into lower-dimensional representations that retain meaningful patterns. These methods are frequently used for data visualization, feature engineering, and preprocessing in machine learning pipelines.
Widely used dimensionality reduction algorithms include Principal Component Analysis (PCA), t-distributed Stochastic Neighbor Embedding (t-SNE), UMAP (Uniform Manifold Approximation and Projection), Autoencoders, and Factor Analysis.
3. Association Rule Mining: Association rule mining identifies relationships between variables in large datasets. Instead of grouping data points, this technique focuses on discovering patterns that show how different items or events are connected. A well-known example is the Apriori algorithm, which is commonly used in market basket analysis. Retailers use this approach to identify products that are frequently purchased together, allowing them to design better product placements, recommendation systems, and marketing strategies.
Some popular association rule algorithms include Apriori, ECLAT (Equivalence Class Clustering and Bottom-Up Lattice Traversal), and FP-Growth (Frequent Pattern Growth).
4. Anomaly Detection: It is designed to identify data points that significantly differ from normal patterns in a dataset. These unusual observations may represent rare events, errors, or suspicious activity. Algorithms such as Isolation Forest and One-Class SVM are widely used to detect anomalies in large datasets. This technique is especially valuable in applications such as fraud detection, cybersecurity monitoring, system health analysis, and fault detection in industrial systems.
Common anomaly detection algorithms include Isolation Forest, One-Class SVM, and Local Outlier Factor (LOF).
5. Density Estimation: It aims to understand the probability distribution of a dataset. By estimating how data points are distributed across a feature space, these methods help analysts gain insights into the underlying structure of the data. Density estimation is commonly used in generative modeling, anomaly detection, and statistical analysis, where understanding the distribution of data is essential for building reliable models.
6. Generative Modeling: It focuses on learning the underlying distribution of a dataset so that new data samples can be generated with similar characteristics. These models are capable of producing synthetic data that resembles real-world data. Generative techniques are widely used in applications such as synthetic data generation, image creation, and natural language processing, where creating realistic data samples can enhance training datasets and support creative AI systems.
Implementing Few Unsupervised Learning Algorithms with Python
Python provides a rich ecosystem of libraries that make implementing unsupervised learning algorithms both efficient and accessible. Tools such as Scikit-learn, NumPy, and Matplotlib allow data scientists to build clustering models, perform dimensionality reduction, and visualize complex datasets with only a few lines of code.
In this section, we will explore practical implementations of several unsupervised learning algorithms using Python. Each example demonstrates how raw data can be analyzed and transformed into meaningful insights through clustering and pattern discovery techniques.
1. K-Means Clustering with Python
K-Means is one of the most widely used clustering algorithms in machine learning. It works by dividing a dataset into K distinct clusters, where each data point belongs to the cluster with the nearest centroid. The algorithm iteratively updates cluster centers until the grouping stabilizes.
Because of its simplicity and computational efficiency, K-Means is frequently used in applications such as customer segmentation, image compression, and pattern discovery in large datasets.
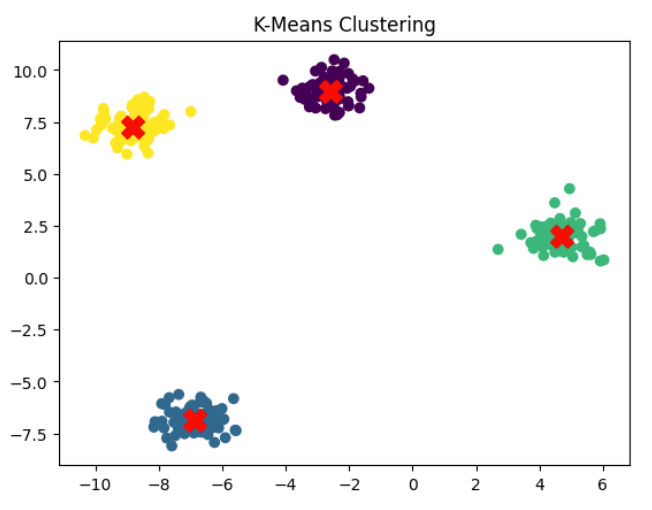
In the following example, we generate a synthetic dataset using make_blobs and apply the K-Means algorithm to identify natural clusters within the data.
from sklearn.cluster import KMeans
from sklearn.datasets import make_blobs
import matplotlib.pyplot as plt

X, y = make_blobs(n_samples=300, centers=4, cluster_std=0.6, random_state=42)

kmeans = KMeans(n_clusters=4, random_state=42)
y_kmeans = kmeans.fit_predict(X)

plt.scatter(X[:, 0], X[:, 1], c=y_kmeans, cmap='viridis')
plt.scatter(kmeans.cluster_centers_[:, 0], kmeans.cluster_centers_[:, 1], s=200, c='red', marker='X')
plt.title("K-Means Clustering")
plt.show()
The dataset contains 300 data points distributed across four clusters. The K-Means algorithm automatically assigns each point to the nearest cluster center. The scatter plot then visualizes the clustering results, while the red markers represent the centroids discovered by the algorithm.
This simple demonstration shows how unsupervised learning can uncover structure in unlabeled datasets and help analysts understand the underlying distribution of data.
2. DBSCAN (Density-Based Spatial Clustering) Clustering
DBSCAN (Density-Based Spatial Clustering of Applications with Noise) is a density-based clustering algorithm designed to identify clusters of arbitrary shapes within a dataset. Unlike centroid-based methods such as K-Means, DBSCAN groups together points that are located in dense regions while labeling isolated points in sparse regions as outliers.
One of the main advantages of DBSCAN is its ability to handle non-linear cluster structures and noisy datasets. Because it relies on density rather than distance to centroids, it can detect clusters with irregular shapes that traditional clustering algorithms often fail to capture. This makes DBSCAN particularly useful in applications such as spatial data analysis, anomaly detection, and pattern discovery in complex datasets.
In the following example, we generate a synthetic dataset using the make_moons function and apply the DBSCAN algorithm to identify clusters based on point density.
from sklearn.cluster import DBSCAN
from sklearn.datasets import make_moons
from sklearn.preprocessing import StandardScaler
import matplotlib.pyplot as plt

X, _ = make_moons(n_samples=300, noise=0.05, random_state=42)
X = StandardScaler().fit_transform(X)

dbscan = DBSCAN(eps=0.3, min_samples=5)
labels = dbscan.fit_predict(X)

plt.scatter(X[:, 0], X[:, 1], c=labels, cmap='plasma')
plt.title("DBSCAN Clustering")
plt.show()
The dataset here contains moon-shaped clusters, which are difficult for centroid-based algorithms to detect. The DBSCAN model groups points based on their local density and automatically identifies outliers that do not belong to any cluster. The resulting scatter plot shows how the algorithm successfully separates the curved clusters.

3. PCA (Principal Component Analysis) with Scikit-learn
Principal Component Analysis (PCA) is one of the most widely used dimensionality reduction techniques in machine learning. It transforms high-dimensional datasets into a smaller number of variables, known as principal components, while preserving as much of the original variance in the data as possible.
By reducing the number of dimensions, PCA makes complex datasets easier to visualize and analyze. It is commonly used for data visualization, noise reduction, feature extraction, and preprocessing before training machine learning models.
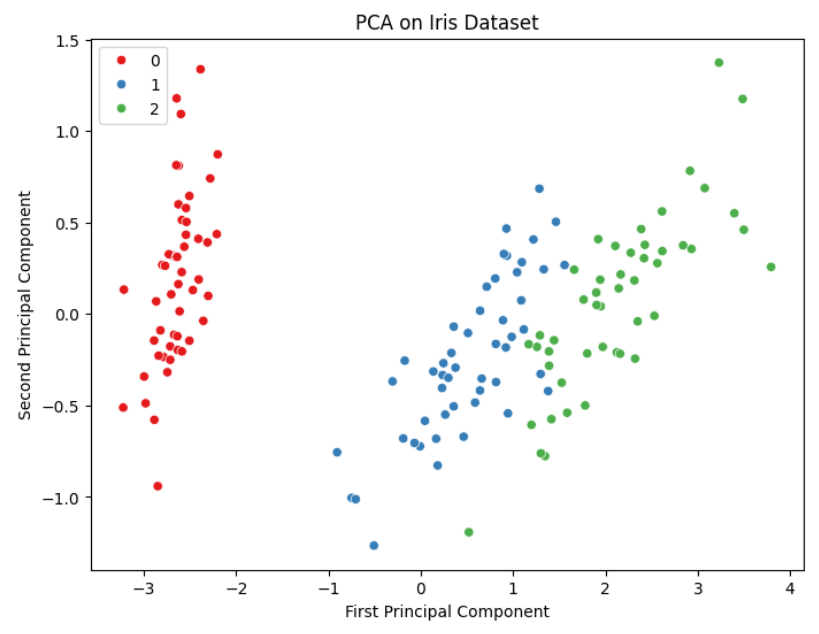
The following example demonstrates how to apply PCA using Scikit-learn on the classic Iris dataset. The dataset contains measurements of different iris flower species, and PCA is used to project the data into two dimensions for visualization.
from sklearn.decomposition import PCA
from sklearn.datasets import load_iris
import seaborn as sns

iris = load_iris()
X = iris.data

pca = PCA(n_components=2)
X_pca = pca.fit_transform(X)

plt.figure(figsize=(8, 6))
sns.scatterplot(x=X_pca[:, 0], y=X_pca[:, 1], hue=iris.target, palette='Set1')
plt.title("PCA on Iris Dataset")
plt.xlabel("First Principal Component")
plt.ylabel("Second Principal Component")
plt.show()
In this example, PCA reduces the original four-dimensional feature space of the Iris dataset into two principal components. This allows the data to be visualized in a two-dimensional scatter plot while still retaining most of the meaningful variance present in the original dataset.
4. Isolation Forest (Anomaly Detection) with Python
Isolation Forest is a powerful algorithm used for unsupervised anomaly detection. Instead of profiling normal data points, the algorithm works by isolating observations through random feature selection and recursive partitioning of the dataset. Points that are easier to isolate typically represent anomalies or outliers, since they differ significantly from the majority of the data.
One of the main advantages of Isolation Forest is its efficiency when working with high-dimensional datasets. Because the algorithm relies on random splits rather than distance calculations or density estimation, it can detect anomalies quickly even in large datasets. This makes it widely used in applications such as fraud detection, system monitoring, cybersecurity, and fault detection in industrial systems.
In the following example, we generate a dataset containing both normal observations and outliers. The Isolation Forest model is then used to identify anomalous points within the dataset.
from sklearn.ensemble import IsolationForest
import numpy as np

rng = np.random.RandomState(42)
X_inliers = 0.3 * rng.randn(100, 2)
X_outliers = rng.uniform(low=-4, high=4, size=(20, 2))
X = np.r_[X_inliers + 2, X_inliers - 2, X_outliers]

clf = IsolationForest(contamination=0.1, random_state=42)
y_pred = clf.fit_predict(X)

plt.scatter(X[:, 0], X[:, 1], c=y_pred, cmap='coolwarm')
plt.title("Anomaly Detection using Isolation Forest")
plt.show()
In this example, the dataset contains a mixture of normal data points and artificially generated outliers. After training the model, the algorithm labels each observation as either normal or anomalous. When the code is executed, the resulting scatter plot highlights how the Isolation Forest algorithm separates unusual data points from the majority of the dataset.

5. Hierarchical Clustering (Agglomerative) with Python
Hierarchical clustering is an unsupervised learning technique that builds clusters by organizing data points into a hierarchy. Instead of assigning points directly to a fixed number of clusters, the algorithm creates a tree-like structure that shows how clusters are progressively formed.
Agglomerative clustering is the most common form of hierarchical clustering and follows a bottom-up approach. In this method, each data point initially represents its own cluster. The algorithm then repeatedly merges the closest clusters until the desired number of groups is formed. This process allows analysts to observe how clusters evolve and how data points relate to each other at different levels of similarity.
Hierarchical clustering is particularly useful when exploring datasets where the relationships between groups are important, such as biological classification, document organization, and customer segmentation.
In the following example, we generate a synthetic dataset and apply the agglomerative clustering algorithm using Scikit-learn.
from sklearn.datasets import make_blobs
from sklearn.cluster import AgglomerativeClustering

X, _ = make_blobs(n_samples=150, centers=3, cluster_std=0.7, random_state=42)

model = AgglomerativeClustering(n_clusters=3)
labels = model.fit_predict(X)

plt.scatter(X[:, 0], X[:, 1], c=labels, cmap='Accent')
plt.title("Agglomerative Hierarchical Clustering")
plt.show()
In this example, the dataset contains three natural clusters. The agglomerative clustering algorithm groups similar data points together by progressively merging clusters based on their similarity. When the code is executed, the scatter plot illustrates how the algorithm separates the data into hierarchical groups.

6. Mean Shift Clustering with Python
Mean Shift is a centroid-based clustering algorithm that identifies clusters by iteratively shifting candidate centroids toward the densest regions of the data. Instead of assigning points to predefined cluster centers, the algorithm repeatedly computes the mean of nearby data points and moves the centroid toward that region.
One of the main advantages of Mean Shift is that it does not require specifying the number of clusters in advance. The algorithm automatically determines the number of clusters based on the density of the data. Because of this property, Mean Shift is often used for tasks such as image segmentation, object tracking, and pattern discovery in complex datasets.
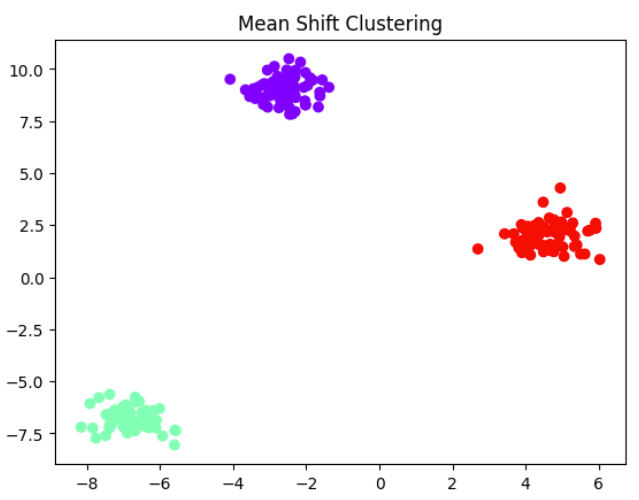
In the following example, we generate a synthetic dataset and apply the Mean Shift algorithm using Scikit-learn to discover natural clusters within the data.
from sklearn.cluster import MeanShift

X, _ = make_blobs(n_samples=200, centers=3, cluster_std=0.6, random_state=42)

meanshift = MeanShift()
labels = meanshift.fit_predict(X)

plt.scatter(X[:, 0], X[:, 1], c=labels, cmap='rainbow')
plt.title("Mean Shift Clustering")
plt.show()
In this example, the algorithm analyzes the density of the dataset and automatically identifies clusters without requiring the number of clusters to be specified beforehand. After executing the code, the scatter plot illustrates how Mean Shift groups the data points into clusters based on their density distribution.
Conclusion
Unsupervised learning fundamentally changes how we approach data analysis. Instead of relying on labeled examples or predefined outcomes, these algorithms allow machines to uncover structure directly from raw datasets. This ability to discover patterns, relationships, and anomalies makes unsupervised learning an essential tool in modern data science.
Techniques such as clustering, dimensionality reduction, and anomaly detection enable analysts to explore complex datasets and reveal insights that might otherwise remain hidden. From identifying customer segments to detecting unusual behavior in large systems, unsupervised learning provides a powerful way to understand data when explicit labels are unavailable.
As organizations continue to generate massive volumes of information, the importance of unsupervised learning will only grow. Mastering these algorithms and implementing them using tools like Scikit-learn allows practitioners to move beyond simple predictions and focus on discovering meaningful patterns within data.
💬 Get Expert Help with Machine Learning Projects
Are you a student tackling a course assignment, a researcher implementing advanced models, or a developer building AI-powered applications? Expert guidance can accelerate your learning and save valuable time. At ColabCodes, we offer:
1:1 coaching for hands-on Python & ML support
Help with clustering, dimensionality reduction, and other unsupervised techniques
Research consultation for academic or applied machine learning projects
Debugging and performance tuning assistance
Academic assignment help
Connect with machine learning mentors who bring both academic knowledge and real-world experience.
📩 Email : contact@colabcodes.com or visit this link for a specified plan.
📱 Whatsapp : +918899822578


