

AB Testing in Python: A Complete Guide with Implementation
- Nov 29, 2025
- 5 min read
AB testing is a widely used method for evaluating product changes by comparing how two user groups respond to different versions of a page, feature, or interface. Instead of relying on assumptions, you can validate ideas using controlled experimentation and measurable results.
This guide explains the core concepts behind AB testing and provides a full Python implementation compatible with both local environments and Google Colab.

What is AB Testing?
AB testing is a methodical approach to comparing two variations of a digital experience to determine which one produces better results. Instead of relying on intuition or preference, this technique introduces a controlled experiment where Version A represents the original experience and Version B contains a deliberate change intended to improve user behavior. Users are randomly divided so that one group sees Version A and the other sees Version B. As they interact with each version, the system tracks meaningful actions such as clicks, signups, purchases, or other engagement metrics. Once enough data is collected, statistical analysis reveals whether the modified version truly performs better or if any differences appear due to random variation. Because of this structured design, AB testing becomes a powerful tool for testing ideas safely and objectively. It is frequently used for landing page improvements, refining call-to-action buttons, smoothing out signup flows, testing different headlines, and adjusting layouts or interface elements. These tests help identify what users respond to most positively in real-world conditions.
Why AB Testing Matters
AB testing is valuable because it replaces assumptions with real evidence. Rather than guessing which design or idea might work, teams rely on measurable user behavior collected during the experiment. This enables consistent improvements in conversion rates and reduces the risk of deploying changes that might harm performance. It also helps align teams around data-backed decisions rather than subjective opinions, creating a more reliable pathway for optimization and product development.
Core Concepts of AB Testing
The effectiveness of any AB experiment relies on a few essential statistical and analytical foundations. These concepts ensure the test is structured correctly, the results are interpreted accurately, and the final decision reflects real user behavior. Understanding these basics helps teams run experiments with confidence and clarity.
1. Hypothesis : Every AB test begins with a clear hypothesis that defines what the team expects to happen. The null hypothesis states that Version B produces no improvement compared to Version A, while the alternative hypothesis suggests that Version B leads to better outcomes. This structure guides the experiment and ensures that the results can be interpreted correctly.
2. Conversion Rate : The conversion rate is a fundamental performance metric calculated by dividing the number of conversions by the total number of visitors. It provides a simple way to quantify how effectively each version drives the desired user action.
Conversion Rate = Total Number of Visitors / Number of Conversions
3. Two-Proportion Z-Test : To compare the conversion rates of A and B, the two-proportion z-test is commonly used. This statistical method helps evaluate whether the difference between the two groups is large enough to be meaningful rather than just noise.

p1 & p2 are the conversion rates of 1 and 2
n1 & n2 are sample sizes for 1 and 2
p0 is the pooled conversion rate across both groups
4. p-Value : The p-value measures the probability that the observed difference occurred by chance. A smaller p-value indicates stronger evidence that one version is performing better than the other.
5. Significance Level : Most experiments use a 95 percent confidence level (α = 0.05). This threshold helps ensure that the conclusion drawn from the test is reliable and not the result of random variation.
AB Testing in Python
Python provides excellent tools for structuring and analyzing AB tests. From data generation to statistical testing to visualisation, the Python ecosystem supports the entire workflow efficiently.
Step 1: Install required libraries
Before running any AB test analysis in Python, you need the foundational libraries that handle data manipulation, numerical operations, statistical testing, and visualization. NumPy and pandas help generate and structure the experimental dataset, statsmodels provides the statistical functions needed for the two-proportion z-test, and matplotlib allows you to create clear charts for interpreting conversion differences visually. Installing these packages ensures your environment is fully equipped for every stage of the experiment.
Local:
pip install numpy pandas statsmodels matplotlibGoogle Colab:
!pip install numpy pandas statsmodels matplotlibStep 2: Generate sample experiment data
This step simulates a real AB testing scenario by generating artificial visitor data for both variants. Using a random seed ensures reproducibility, while NumPy’s binomial distribution models user conversions realistically based on defined conversion rates. The resulting dataset contains thousands of simulated user interactions across Version A and Version B, stored neatly in a pandas DataFrame for easy analysis. This structured input mimics the type of data you would collect from an actual live experiment.
import numpy as np
import pandas as pd

np.random.seed(42)

visitors_A = 5000
visitors_B = 5000

conversion_rate_A = 0.10
conversion_rate_B = 0.13

conversions_A = np.random.binomial(1, conversion_rate_A, visitors_A)
conversions_B = np.random.binomial(1, conversion_rate_B, visitors_B)

data = pd.DataFrame({
    "variant": ["A"] * visitors_A + ["B"] * visitors_B,
    "converted": np.concatenate([conversions_A, conversions_B])
})

print(data.head())
Output:
variant | converted | |
0 | A | 0 |
1 | A | 1 |
2 | A | 0 |
3 | A | 0 |
4 | A | 0 |
Step 3: Calculate conversion summaries
Once the data is generated, the next step is to compute basic summaries that reveal how each variant performed. Grouping the dataset by variant allows you to calculate total conversions, total visitors, and conversion rate for each version. These summaries form the foundation for statistical comparisons and help you understand the raw performance difference before diving into significance testing.
conversion_summary = data.groupby("variant")["converted"].agg(["sum", "count"])
conversion_summary["rate"] = conversion_summary["sum"] / conversion_summary["count"]
print(conversion_summary)
Output
sum count rate
variant
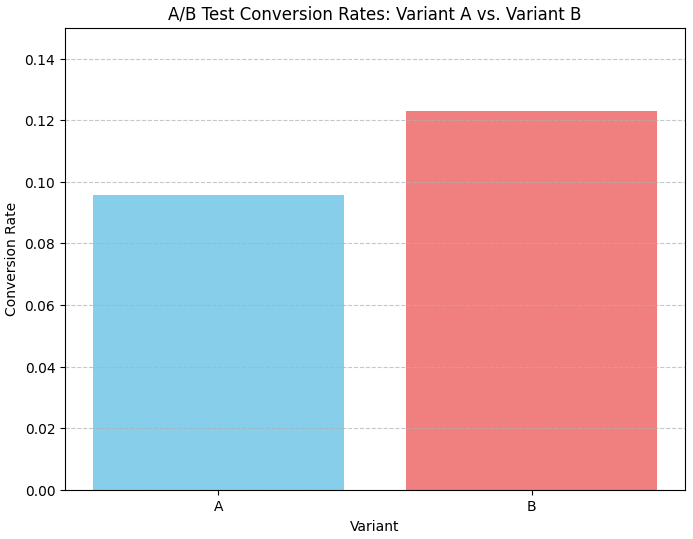
A 479 5000 0.0958
B 615 5000 0.1230Step 4: Run the two-proportion z-test
The two-proportion z-test provides a statistical measure of whether the conversion difference between Version A and Version B is meaningful. By passing in the number of conversions and sample sizes for both groups, the test outputs a z-statistic and a p-value. These values reveal how strong the difference is and help determine if Version B genuinely outperforms Version A rather than achieving a better result through random variation.
from statsmodels.stats.proportion import proportions_ztest

conversions = conversion_summary["sum"].values
samples = conversion_summary["count"].values

z_stat, p_value = proportions_ztest(conversions, samples)

print("Z-Statistic:", z_stat)
print("p-Value:", p_value)

Output:
Z-Statistic: -4.357013463835075
p-Value: 1.3184916035240525e-05
Step 5: Interpret the test result
After obtaining the p-value, the next step is to compare it against the significance level (commonly α = 0.05). This comparison determines the final outcome of your experiment. If the p-value falls below the threshold, you can confidently conclude that Version B performs significantly better. Otherwise, the experiment does not provide strong enough evidence to claim a real difference. This interpretation step ensures your results are grounded in proper statistical reasoning.
alpha = 0.05

if p_value < alpha:
    print("Result: Version B performs significantly better than Version A.")
else:
    print("Result: No statistically significant difference between A and B.")

Output:
Result: Version B performs significantly better than Version A.
Step 6: Visualize conversion differences
Visualization provides an intuitive way to understand how the two variants performed. A simple bar chart comparing conversion rates makes the difference between Version A and Version B immediately clear. This visual representation is helpful for presentations, stakeholder discussions, and quick assessments, turning numerical results into easy-to-understand insights.
import matplotlib.pyplot as plt

plt.figure(figsize=(8, 6))
plt.bar(["A", "B"], conversion_summary["rate"], color=['skyblue', 'lightcoral'])
plt.ylabel("Conversion Rate")
plt.title("A/B Test Conversion Rates: Variant A vs. Variant B")
plt.xlabel("Variant")
plt.grid(axis='y', linestyle='--', alpha=0.7)
plt.ylim(0, 0.15) # Set y-axis limit for better comparison
plt.show()
Output:
Conclusion
AB testing provides a practical and reliable way to improve digital experiences using real user data rather than assumptions. By comparing two versions of a page or feature, measuring how users behave, and applying statistical methods like the two-proportion z-test, teams gain clarity about which changes truly make an impact. The Python workflow demonstrated above shows how easy it is to structure an experiment, analyze results, and visualize performance differences. As businesses continue to optimize their products, AB testing stands out as one of the most effective tools for making confident, data-driven decisions that steadily enhance user engagement and conversion outcomes.


