

A Guide to Console Object in JavaScript
JavaScript provides the console object as a built-in debugging and development tool that allows developers to monitor application behavior, inspect data, identify errors, and test code more effectively. Whether you're working in a web browser or a Node.js environment, the console serves as a valuable interface for displaying information and gaining insights into how your code is executing behind the scenes.
While many developers are familiar with console.log(), the console object offers a much broader set of features designed to simplify troubleshooting and performance analysis. From displaying warnings and errors to measuring execution time and organizing output into structured formats, these methods can significantly improve the development and debugging experience.
In this tutorial, you'll learn what the JavaScript console object is, why it is an essential tool for developers, and how to use its most commonly used methods through practical examples. By the end, you'll have a solid understanding of how to leverage the console effectively to write, test, and debug JavaScript applications with greater confidence.
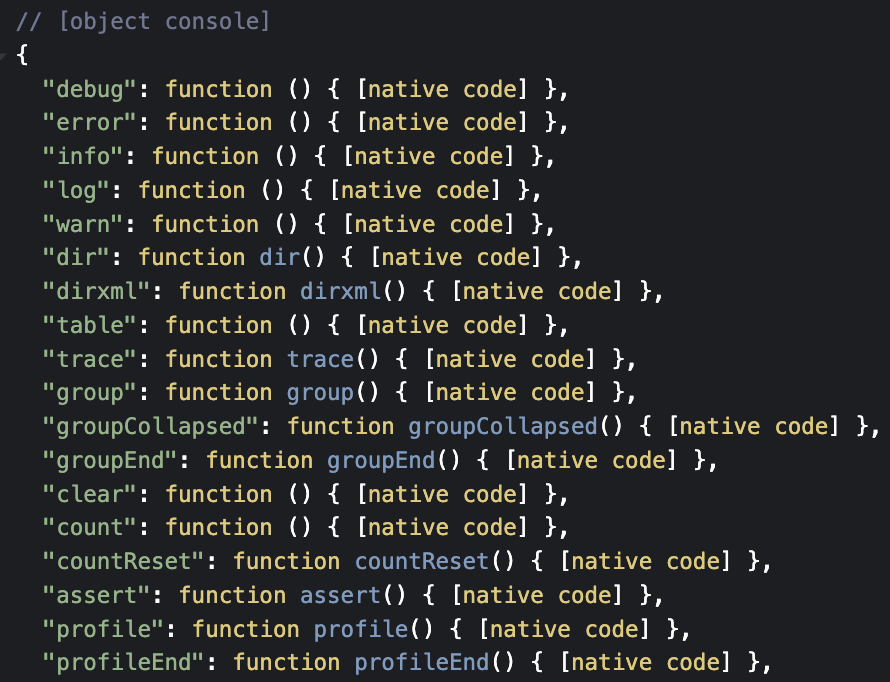
What is the Console Object in JavaScript?
The console object is a built-in JavaScript feature that provides a simple yet powerful way to interact with the browser's developer console or a runtime environment such as Node.js. It serves as a debugging and development tool, allowing developers to display messages, inspect variables, monitor application behavior, and troubleshoot issues while writing and testing code.
In web browsers, the console object is provided through the browser's developer tools, enabling developers to view logs, warnings, errors, and other diagnostic information. In Node.js, the console object is implemented directly by the runtime and offers a similar set of methods for displaying output in the terminal. Although the core functionality remains consistent across environments, there may be minor differences in formatting and behavior.
The console object plays a vital role during development by helping developers understand how their code is executing and where problems may occur. It can be used to:
Display values of variables, objects, arrays, and function results.
Identify bugs and unexpected behavior through error and warning messages.
Inspect complex data structures in a readable format.
Measure the execution time of code for performance analysis.
Organize output using groups, counters, and tabular displays.
Track the flow of program execution during debugging.
While console.log() is the most commonly used method, the console object includes a rich collection of additional methods designed for specific debugging and diagnostic tasks.
Learning how to use these methods effectively can significantly improve your productivity and make the development process more efficient.
Common Methods of the console Object
The console object provides a variety of methods that go far beyond simple message logging. These methods help developers monitor application behavior, identify errors, inspect data, and analyze code execution more effectively. Understanding the purpose of each method can make debugging faster and significantly improve the development workflow.
1. console.log()
The console.log() method is the most frequently used console method. It outputs general information to the console and is commonly used to display variable values, function results, and application state during development. Because it accepts multiple arguments, it can be used to combine descriptive text with dynamic data, making debugging more informative and readable.
console.log("Hello, world!");
let number = 42;
console.log("The number is:", number);
In this snippet, the first statement displays a simple text message, while the second outputs a label along with the value stored in the number variable. This makes it easy to verify that variables contain the expected values at different stages of program execution.
2. console.error()
The console.error() method is used to display error messages in the console. In most browsers, these messages are highlighted in a distinct color, often red, making them easier to spot among other console output. This method is particularly useful for reporting failed operations, invalid input, or unexpected application behavior.
console.error("An error occurred!");Using console.error() helps differentiate critical issues from regular log messages, allowing developers to quickly identify and investigate problems during testing and debugging. It is often used within error-handling logic to provide clear feedback when something goes wrong.
3. console.warn()
The console.warn() method is used to display warning messages in the console. These messages are typically highlighted with a warning icon or a distinct color, such as yellow, making them stand out from regular log entries. Warnings are useful for notifying developers about potential issues that do not immediately break the application but may lead to unexpected behavior if left unaddressed.
console.warn("This is a warning!");Unlike errors, warnings indicate situations that deserve attention but do not necessarily prevent the program from running. They can be used to flag deprecated features, missing configuration values, or other conditions that developers should review during testing.
4. console.info()
The console.info() method is designed for displaying informational messages in the console. In many modern browsers, its behavior is similar to console.log(), although some environments may apply different formatting or icons to distinguish informational output from standard logs.
console.info("This is some information.");Informational messages are often used to provide updates about application events, execution flow, or system status. Using console.info() can make console output more descriptive and easier to categorize when debugging larger applications.
5. console.table()
The console.table() method presents data in a structured table format, making it particularly useful for working with arrays and objects. Instead of displaying raw object data, it organizes information into rows and columns, improving readability and making patterns easier to identify.
const users = [
    { name: "Alice", age: 25 },
    { name: "Bob", age: 30 },
    { name: "Charlie", age: 35 }
];
console.table(users);
When executed, the console displays a table containing the properties of each object in the array. Each object becomes a row, while the object properties appear as column headers. This format is especially helpful when inspecting collections of data, comparing values, or debugging complex datasets, as it provides a clear visual representation that is easier to analyze than standard log output.
6. console.group() and console.groupEnd()
When working with a large number of log statements, the console can quickly become cluttered and difficult to navigate. The console.group() and console.groupEnd() methods help organize related messages into collapsible sections, making the output more structured and easier to read.
console.group("User Details");
console.log("Name: Alice");
console.log("Age: 25");
console.groupEnd();
The text passed to console.group() serves as the group label, while all log statements between console.group() and console.groupEnd() are nested within that group. This is particularly useful when debugging complex applications where logs are generated from multiple components or functions.
7. console.time() and console.timeEnd()
Performance analysis is an important part of software development, and the console.time() and console.timeEnd() methods provide a simple way to measure how long a specific operation takes to execute.
console.time("Timer");
for (let i = 0; i < 1000000; i++) {} // Simulating a task
console.timeEnd("Timer");
The timer starts when console.time() is called and stops when console.timeEnd() is executed using the same label. The console then displays the elapsed time, helping developers identify performance bottlenecks and compare the efficiency of different implementations.
8. console.assert()
The console.assert() method is used to test a condition and display a message only when that condition evaluates to false. This makes it a useful debugging tool for verifying assumptions in your code without producing unnecessary output when everything is working as expected.
let x = 10;
console.assert(x > 15, "x is not greater than 15");
Since the condition x > 15 is false, the specified message is displayed in the console. If the condition were true, nothing would be logged. Assertions are particularly useful for validating function inputs, checking expected states, and detecting logical errors during development.
9. console.clear()
As applications generate more logs, the console can become crowded with messages that are no longer relevant. The console.clear() method removes all existing output from the console, providing a clean workspace for further debugging.
console.clear();This method is often used during development when developers want to focus on fresh output without manually clearing the console through the browser's developer tools. Keep in mind that some browsers may restrict or modify its behavior depending on their settings.
10. console.trace()
The console.trace() method prints a stack trace that shows the sequence of function calls leading to a particular point in the code. This can be extremely helpful when trying to determine how execution reached a specific function or location.
function firstFunction() {
    secondFunction();
}
function secondFunction() {
    console.trace("Trace example");
}
firstFunction();
When the trace is generated, the console displays the call stack, showing that firstFunction() invoked secondFunction(), which then executed console.trace(). This information can be invaluable when debugging complex applications, especially when functions are called indirectly through multiple layers of execution.
11. Using String Substitutions
The console object supports string substitutions, allowing dynamic values to be inserted directly into log messages using placeholders.
This can make output more concise and readable, especially when working with multiple variables or complex data. Common placeholders include:
1. %s for strings
2. %d for numbers
3. %o for objects
console.log("Hello, %s!", "World");
console.log("I have %d apples.", 5);
console.log("Object: %o", { a: 1, b: 2 });
When these statements are executed, the placeholders are automatically replaced with the provided values. This approach can improve readability by keeping messages and variable data within a single formatted string rather than passing multiple arguments separately.
12. Styling Logs
Modern browsers allow developers to apply CSS styling to console messages using the %c placeholder. This feature can be useful for highlighting important information, categorizing logs, or making debugging output easier to identify within a busy console.
console.log("%cStyled Text", "color: blue; font-size: 20px; background: yellow;");The first argument contains the %c placeholder, while the second argument specifies the CSS rules that should be applied to the text. Although styling should be used sparingly, it can be valuable for emphasizing warnings, status updates, or important debugging information.
13. Custom Debugging
Many of the console methods discussed throughout this guide can be combined to create a more structured and effective debugging workflow. By using groups, logs, warnings, and errors together, developers can organize diagnostic information in a way that is easier to analyze and maintain.
console.group("Debugging");
console.log("Variable X:", 10);
console.warn("Potential issue with Y.");
console.error("Critical error occurred!");
console.groupEnd();
This approach groups related debugging information under a single heading while clearly distinguishing regular messages, warnings, and errors. As applications become larger and more complex, combining console methods strategically can significantly improve the debugging process and make it easier to identify the source of issues quickly.
By mastering these advanced console techniques, developers can transform the console from a simple logging tool into a powerful environment for monitoring application behavior, diagnosing problems, and improving code quality during development.
Conclusion
The JavaScript console object is much more than a simple logging utility. It provides a comprehensive set of tools that help developers inspect data, track application flow, identify errors, measure performance, and organize debugging information effectively. From basic methods like console.log() and console.error() to advanced features such as console.table(), console.group(), console.time(), and console.trace(), the console offers valuable insights into how your code behaves during execution.
Developing a strong understanding of these methods can significantly improve your debugging workflow and make it easier to diagnose issues in both small scripts and large-scale applications. By using the right console method for the right situation, you can create clearer diagnostic output, analyze performance more efficiently, and gain a deeper understanding of your application's behavior. As you continue building JavaScript projects, the console will remain one of the most essential tools in your development toolkit, helping you write cleaner, more reliable, and easier-to-maintain code.


